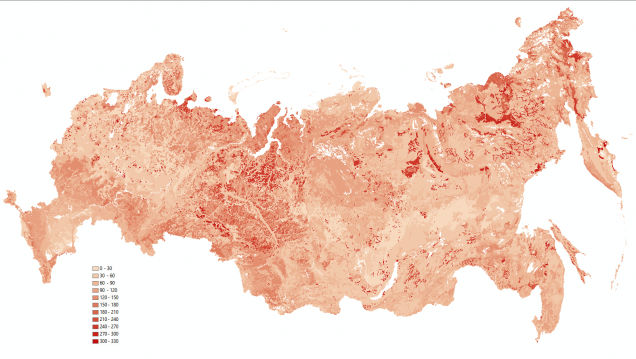
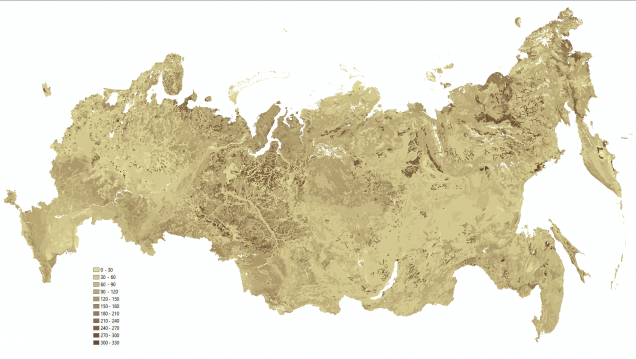
Soil Organic Carbon map (GSOC Map) of Russia, covering a depth of 0-30 cm
Soil Organic Carbon map (GSOC Map) of Russia
Russian soil science has a solid background both on soil organic carbon content researches and its mapping. However, for such an extensive country as Russia with its huge territory and great variety of natural conditions, achieving requirements of precision and accuracy stated in GSOC17 is possible only through the coordinated effort of many scientific and government organizations.
Soil Data Center of Moscow State University coordinates the creation of Soil Organic Soil Map of the entire territory of the Russian Federation.
Soil Data Center of Moscow State University is the organizer of an initiative on different-scale soil data exchange over distributed network of soil data centers that is currently carrying out in Russia. The work is carried out on the basis of the Information System of Soil Data Center – Soil-Geographical Database (SGDB) corresponding with to the ideology of the Global Soil Partnership Program.
Information System of Soil Data Center – Soil-Geographical Database (SGDB) allows to handle a lot of data accumulated in a centralized store by various institutions. The SGDB contains different-scale maps, attributive data of geographically referenced objects, both point (soil profiles) and polygonal. The SGDB contains also vector soil map, soil-geographical zoning map, forest and land use map, landscape map, all at a scale of 1:2.5 M.
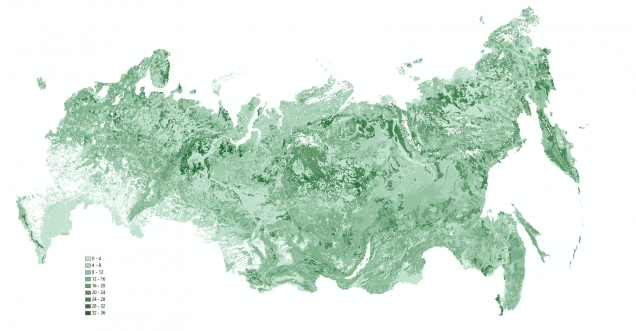
In accordance with the concept of the distributed network of soil data centers and of storing detailed data, the calculation of a SOC map covering a depth of 0-30 cm performed in the form of synthesis of two types of source data:
а) a map of the entire territory of the Russian Federation based on soil, landscape and land cover maps at the scale of 1:2.5 M combined with sparse and irregular grid of about 2000 soil profiles.
Used: >25000 soil polygons (SMU), the legend consists of >300 items. Some items in legend describe nonsoil (or almost not soil) areas.
Carbon content for these items is set equal minimal values to preserve possibility in future to discriminate them and to differ them from ‘no data” value (see table below).
| Corg. kg/m2 | Legend items |
|---|---|
| 0.00005 | Stone deposits |
| 0.00004 | Crumbly solids |
| 0.00003 | Sand |
| 0.00002 | Gletchers |
| 0.00001 | Internal basins |
Calculations of bulk density and carbon content in first soils of each polygon (SMU) with and without using pedotransfer functions described in Appendix.
b) maps of separate agricultural areas based on the large-scale soil maps and a dense grid of regular soil observations according to the data obtained in coordination with the Ministry of Agriculture of the Russian Federation. Two maps of SOC were created in a compact area of about 15 million hectares of the Chernozem zone of the European part of the Russian Federation. There were used soil data from recent (2012-2016) soil surveys for this territory, and from legacy observation (1970th), with an average density of points not less than 1 point per kilometer, as well as vector soil maps at the scales of 1:25000 - 1:50000. Used: > 150 000 point observations (during 2012-2016), > 15000 SMU.
Used: >150000 point soil data from soil surveys 2012-2016 and >15000 soil polygons (SMU).
Both a) and b) maps were merged in one grid (agricultural land SOC map (b) was put over the entire Russia 1:2.5 M SOC map (a)).
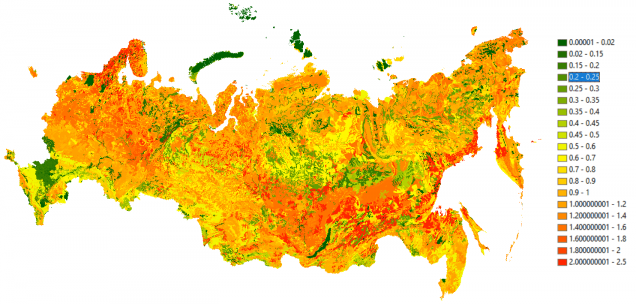
There is a map of errors for merged grid.
Since the SOC map was composed by incorporating various approaches and methodologies, error map was also created based on various approaches. For the main part of Russia territory the relative error of carbon stock below the litter level was estimated for each polygon (SMU). The maximum of error can be observed for soil polygons where bulk density was determined as average with few representative profiles. For some areas the relative error is over 200%.
For chernozem area with high density of observations relative error is about 25%. Some areas were estimated according to regression equations for bulk density calculations, RMS error is about 25%.
Validation of main part of territory estimated as relative error – as fraction of standard deviation divided by average value. The normal distribution is assumed.
There are related Excel sheets with soil area names, min, max and average value of bulk density to be calculated in ArcGIS.
The SOC map for litter and peat is also calculated. Due to inadequacy of empirical data relative error can’t be estimated for litter and peat so this layer data are not taken onto account in error map.
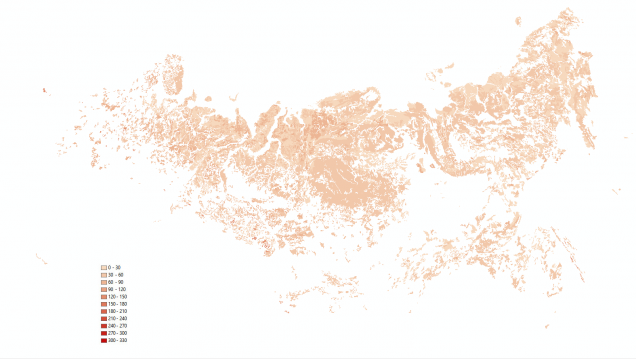
c) The SOC map for litter is calculated on the base of previously published map by D.G.Shepashenko et al., 2013, adapted to the GSOC17 requirements. This layer data are also not taken onto account in error map.
Soil Organic Carbon Map of Russia map on the Global Soil Organic Carbon Map (GSOCmap) is a sum of all three layers that is mineral, litter and peat.
All maps are in .tiff (float 32 bit) format in WGS84 (4326) GCS with ½ angular minute step and extension -180 : 180 degrees. Values are measured in kilograms of C per square meter.
All source vector and raster map layers are available as ArcGIS v.10.1 project.
Total carbon content of soils in a depth of 0-30 cm in Russian Federation is estimated about 151Pg (gigaton) (147Pg (gigaton) according with FAO estimation subject to the discrepancy of water and administrative borders).
About 15.6 Pg (gigaton) of the carbon content falls to the share of litter.
For most part of soil profiles data the bulk density indices for soil horizons are absent. Applicability of equations of O.V.Chestnyh and D.G.Zamolodchikov for bulk density calculation of various soil were estimated using SGDB,
BW= a1 – a2/(MID+a3) + a4/(HUM+a5),
где:
- BW – bulk density, g./sm3
- HUM – humus content in the horizon,%
- MID – average height of horizon, sm
Equation parameters
| a1 | a2 | a3 | a4 | a5 | |
|---|---|---|---|---|---|
| podzolic | 0.252 | 9.110 | 9.939 | 110.999 | 78.805 |
| steppe | 1.413 | 27.045 | 33.905 | 2.390 | 5.449 |
It was discovered that for «podzolic» soils (in terms of O.V.Chestnyh and D.G.Zamolodchikov) that is podzolic, podzolic gleyic and gleyed, soddy-podzolic, light gray forest, etc. and for «soddy» soils that is dark gray forest, chernozems, podzolized, leached, typical, ordinary, southern, dark chestnut etc, bulk density values calculated using the equation show good coincidence with actual ones.
In the case of absence of actual values for two mentioned rows the bulk density for horizons calculated on the base of this equation. Then SOC for mineral horizon up to 30 sm depth was calculated and averaged for each polygon (SMU).
For other soils bulk density values calculated on the base of averaged expert estimations.
Carbon stock for peat bog soils (high-moor, low-moor and transitional bogs) were estimated with factor of ash content and density for corresponding peat on the base of values from paper of Inisheva et al. (2012).